Why Real-Time Walls Beat Traditional Dashboards
Remember the last time you checked a dashboard? You probably logged in, waited for it to load, clicked refresh a few times, and wondered if the data was actually current. Traditional dashboards are like newspapers in a world that moves at Twitter speed.
The Dashboard Problem
Traditional dashboards suffer from three fatal flaws:
1. They're Delayed
Most dashboards poll APIs every few minutes (at best). By the time you see that spike in traffic or drop in sales, the moment has passed. You're always playing catch-up.
2. They're Isolated
Dashboards live in their own world. Want to show real-time metrics on your website? Good luck embedding that Grafana panel without exposing your entire infrastructure.
3. They're Static
Dashboards show what happened. Walls show what's happening. The difference? One helps you react, the other helps you act.
Enter VitalWall: Living Data
VitalWall isn't another dashboard tool. It's a real-time visualization layer that turns any data stream into a living, breathing display.
Event-Driven, Not Poll-Based
When a customer buys, a ticket sells, or a sensor triggers, VitalWall shows it instantly. No refresh button. No lag. Just pure, real-time flow.
Display Anywhere
Unlike dashboards locked behind logins, VitalWalls embed anywhere:
- Your website's homepage
- Office lobby displays
- Sales team screens
- Public status pages
Visual Variety
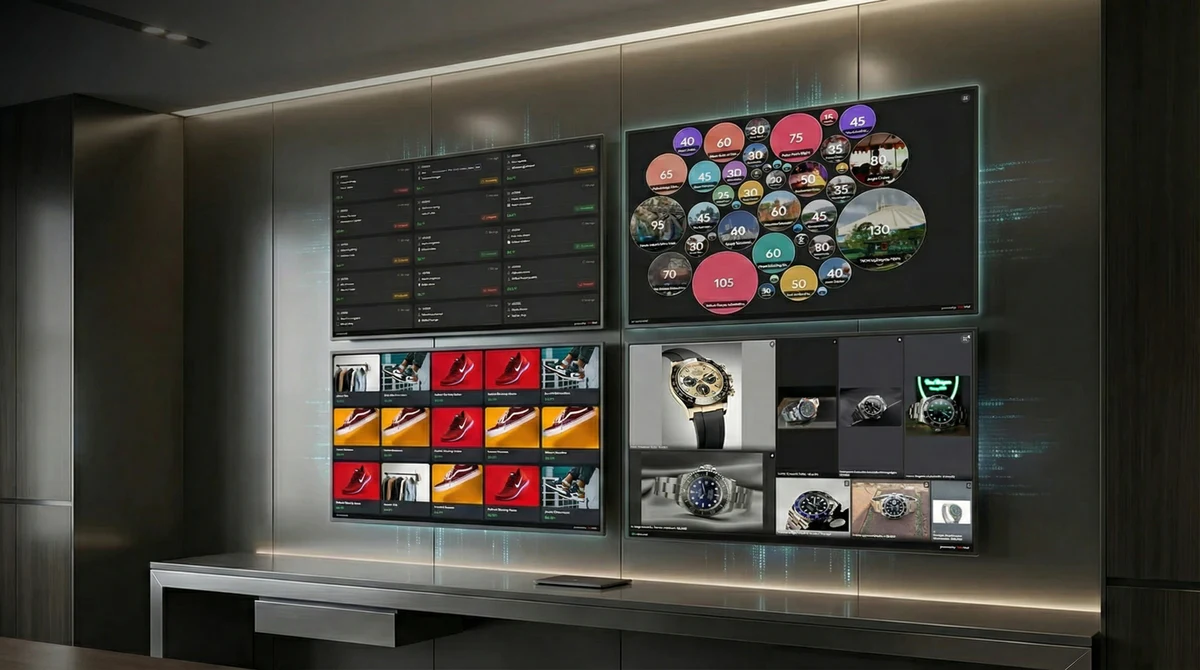
Choose from 6 visualization types:
- GRID: Perfect for support tickets, orders, bookings
- LIST: Ideal for activity feeds, logs, notifications
- TICKER: Great for trades, sales, real-time updates
- TREEMAP: Shows hierarchies and quantities visually
- BUBBLE: Size-based visualizations for wait times, metrics
- MAP: Geographic data visualization
Real-World Examples
E-commerce Store
Traditional dashboard: Check daily sales report at 9am VitalWall: Watch purchases happen live on your homepage
Restaurant
Traditional dashboard: Review yesterday's order volume VitalWall: Display orders to kitchen staff instantly
Support Team
Traditional dashboard: Refresh ticket queue every 5 minutes VitalWall: See new tickets the second they arrive
Trading Platform
Traditional dashboard: 15-minute delayed charts VitalWall: Every trade displayed as it executes
The Psychology of Real-Time
There's something powerful about seeing data move. It creates:
Urgency: "Others are buying right now"
Trust: "This is actually happening"
Energy: "This business is alive"
Static numbers are forgettable. Moving data is memorable.
Technical Advantages
No Polling Required
// Traditional dashboard
setInterval(fetchData, 60000); // Poll every minute

// VitalWall
vitalWall.track('purchase', data); // Push instantly
Simple Integration
<!-- That's it. Seriously. -->
<div data-vital-wall="your-wall-id"></div>
Custom Styling
Every wall accepts custom CSS. Match your brand perfectly without wrestling with dashboard themes.
When to Use Each
Use Traditional Dashboards For:
- Historical analysis
- Complex calculations
- Private metrics
- Deep-dive investigations
Use VitalWall For:
- Real-time displays
- Public/embedded views
- Social proof
- Live operations
- Customer-facing metrics
The Future is Living Data
We're moving from a world of reports to a world of streams. From snapshots to motion pictures. From "what happened" to "what's happening."
Traditional dashboards will always have their place for analysis. But for engagement, excitement, and real-time awareness, walls are the future.
Ready to bring your data to life? Start with VitalWall - no credit card required.
VitalWall: Where data comes alive.