
Ticker, Treemap or Map? Picking the Right Live Wall Layout
Six layouts, one question: what should the room notice?
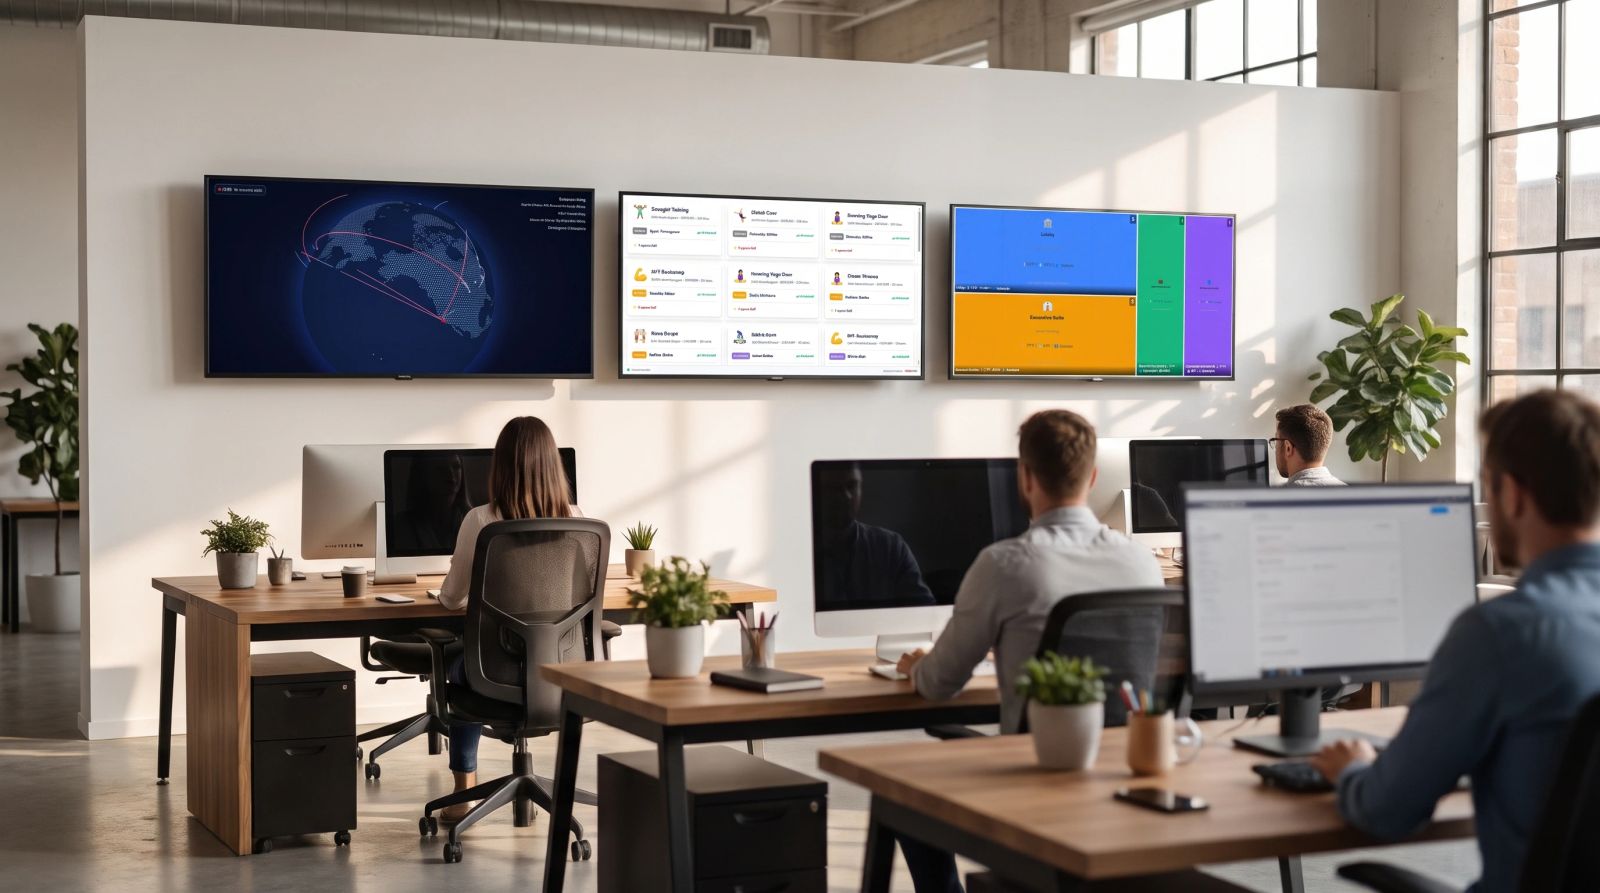
The layout decides whether anyone reads the wall.
The data can be right and the wall can still fail if nobody can read it from across the room. VitalWall has six layouts: list, grid, ticker, treemap, map and bubble. Here is how we pick between them.
Start with the room, not the data
A live wall is for awareness, not analysis. People glance at it while they walk past or while they work. So before picking a layout, answer three questions:
- How far away is the viewer? Across the office, at a desk, or on a web page?
- What should they notice? A new event, the biggest item, or where things are happening?
- How fast does the data move? A few items an hour, or a steady stream?
The answers point to a layout.
List: the newest thing on top
A list is the plainest layout. New items land at the top and older ones move down. Anyone can read it the first time they see it.
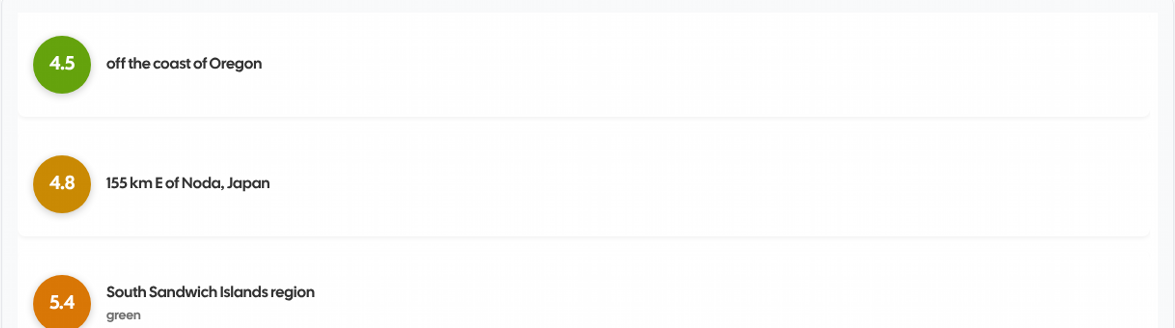
Use a list when each item matters on its own: a new order, a new signup, a new item an agent posted. If you want the room to notice each one, start here.
Grid: many items at a glance
A grid puts items in tiles, so more fit on one screen. It suits a big TV where people stand back and scan the whole thing.
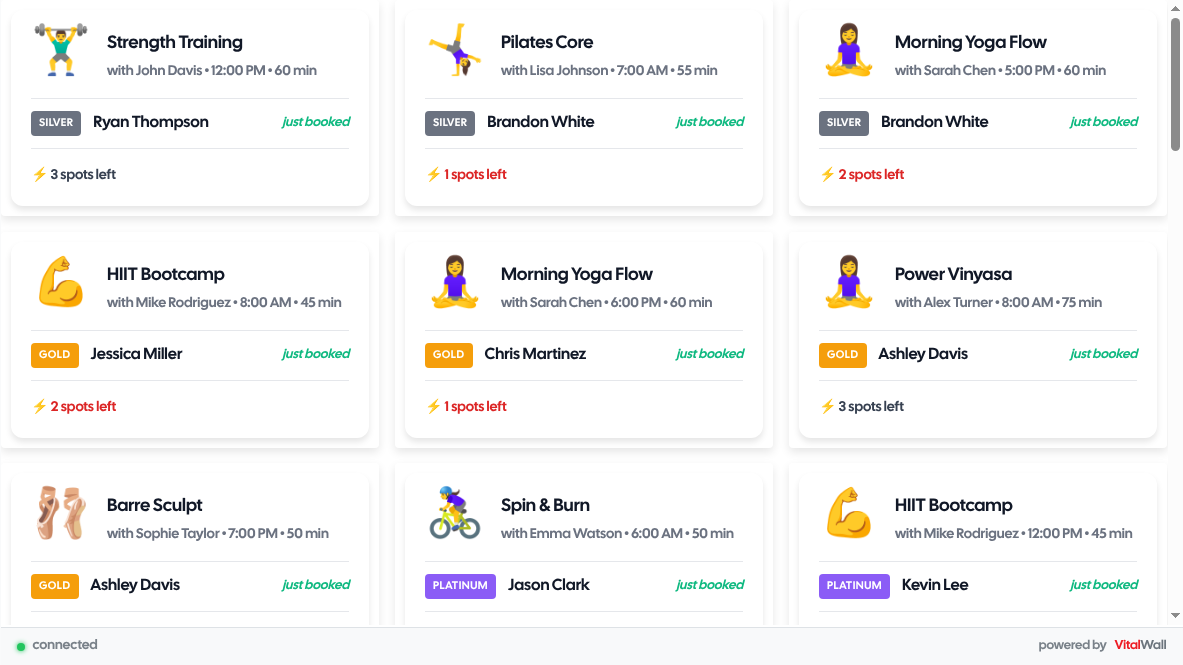
Reach for a grid when the wall has more going on than a list can show at once, and you still want each item to be its own card.
Ticker: a moving line of activity
A ticker runs items along a single line. It takes up little space and says one thing: activity is happening.

A ticker works along the bottom of a screen, above a door, or on a site where a full wall would be too much. It is not the layout for reading details. It is the layout for a pulse.
Treemap: what is biggest right now
A treemap sizes each block by how often its item shows up. Big things take up more of the screen, so you can see which one is winning without reading a word.
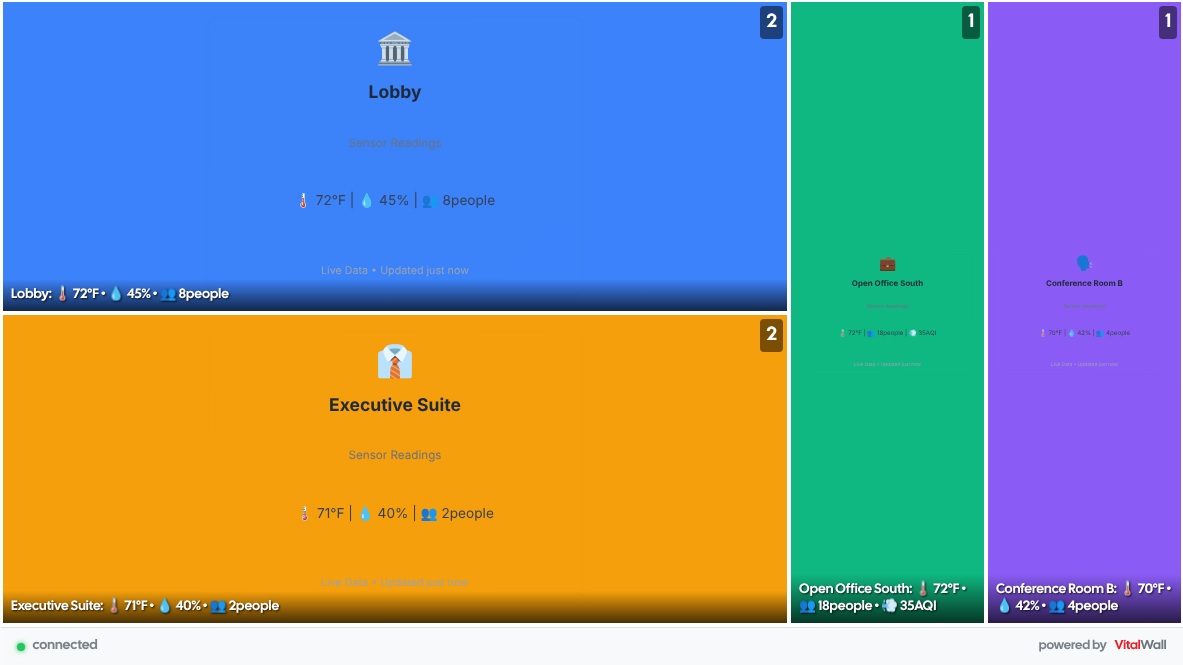
Use a treemap when the question is "what is selling" or "where is the volume," not "what just happened."
Map: where things are happening
The map layout puts activity on a spinning 3D globe. When location is the interesting part, a globe tells that story faster than any list.

It is also the layout behind the visitor globe, which records visits on its own and drops a pin the moment someone lands on your site. We walked through that setup in How to Show Your Website Visitors on a Live Globe.
Bubble: size and motion together
A bubble layout packs items as circles sized by their value. It shows relative size like a treemap but feels more alive on a screen.
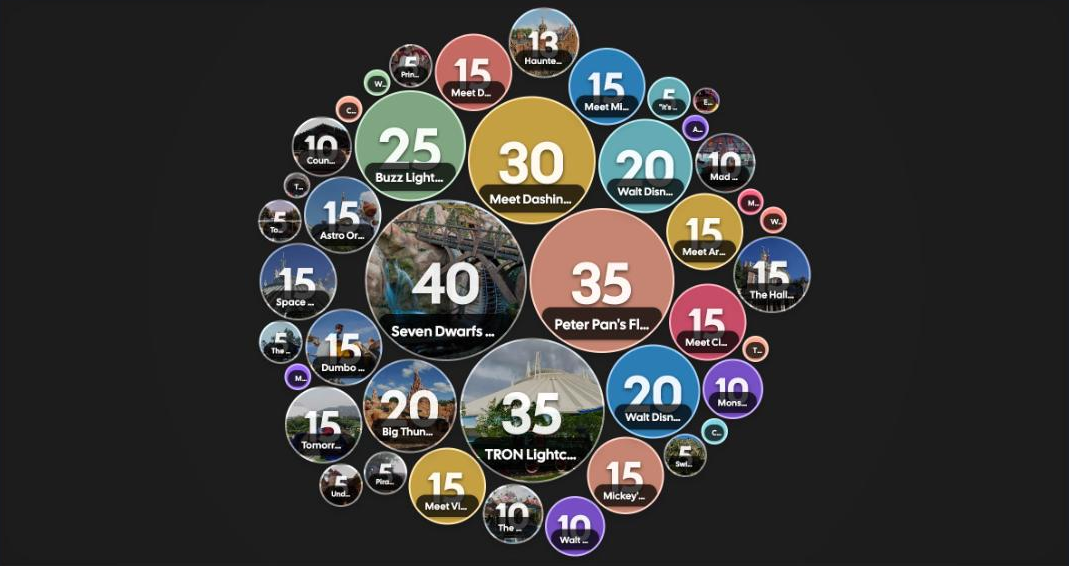
Use bubbles when you want a wall that draws the eye and still shows which items are biggest.
Feeding a wall
The layout and the data source are separate choices, so you can switch layouts without touching how the data gets in. A wall gets data three ways:
- Events. Your site sends an item when something happens, with a
<vital-track>tag or one line of JavaScript from the VitalWall script, and the wall updates live. - APIs. Point a wall at a JSON endpoint you already have. VitalWall fetches it on the server, with a 30 second minimum refresh.
- AI agents. Claude and other agents can create walls and post items through the VitalWall MCP server.
The short version
- Each item matters: list.
- Lots of items on a big screen: grid.
- Small space, just a pulse: ticker.
- What is biggest: treemap.
- Where it is happening: map.
- Biggest, with motion: bubble.
The best way to choose is to watch them run. Open the demo gallery, look at a few live walls, then try two layouts on the same data. The one people actually look at is the right one.
Want to see your own data move? Start free on VitalWall. No credit card needed.
Related Posts

Real-Time Visibility Beats Analytics Dashboards (Here's Why)
Your analytics dashboard is lying to you. Not about the numbers. Those are probably accurate. But about what actually matters for running your business. The problem with dashboards is temporal. They show you what happened. What you need is what's happening right now.

How to Show Live Sales on a TV Screen in Your Office or Warehouse
Your fulfillment team is guessing how the day is going. A live sales dashboard on a TV screen changes that. Here's how to set up a real-time ecommerce display in 15 minutes.

How to Set Up Your First VitalWall in 5 Minutes
How to Set Up Your First VitalWall in 5 Minutes